Ghana Data Stuff

Ghana Data Stuff

Welcome

Welcome on the website “Ghana Data Stuff”. This is a portfolio website I built to showcase some of the side projects I am working on at night, while working on more ‘official’ statistics for Ghana during the day. The original name of this project was “Ghana Data Science”, but then I realized that I do not really want to do any science. I just want to play with data a bit, hence the name “Ghana Data Stuff”. This also means that I will try not to do the same type of project more than once or twice. For every post, I will challenge myself to use a new technique, R Package, Python Library, coding language or other skill. I will then write out a little walk-through documenting my work flow. So, the posts on this website are not detailed tutorials, but should be sufficiently documented for readers to replicate the results for themselves. If you have any good ideas for a project, let me know and we can work on it together.

So to clarify, nothing on this website should serve an ‘official’ statistic or even be interpreted as being reliable or verified.
Interest

R

Python

Statistics

Machine Learning

data visualizations

Cartography

Recent Posts

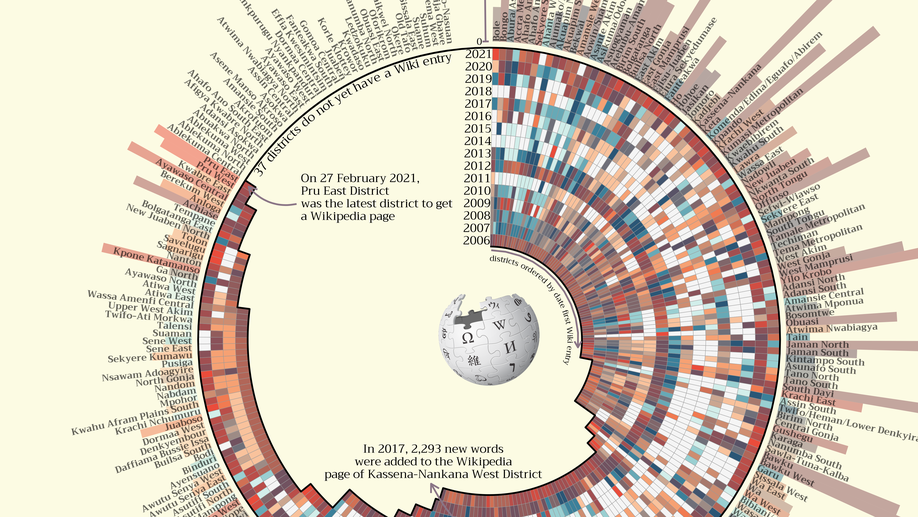
Using R to Web Scrape Wikipedia and Visualize the Results.

Using R to Web Scrape Wikipedia and Visualize the Results.

In this walkthrough I show how to use R to scrape and analyse data from Wikipedia and then vizualise the results in a somewhat over-eloborate circular heatmap

Using R to Animate the Population Density of Ghana

Using R to Animate the Population Density of Ghana

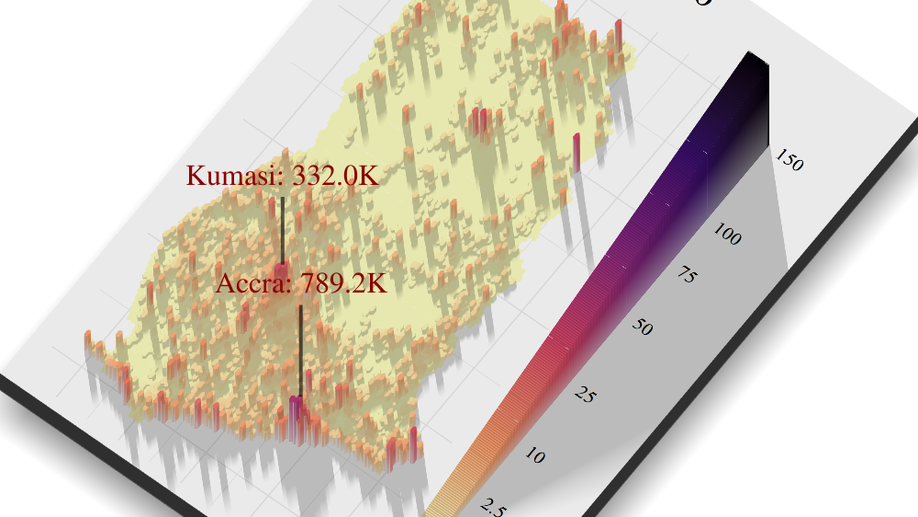
In this walkthrough I show how to use R to dowload population density data for a country and then how transform that data into interactive leaflet maps and a animation

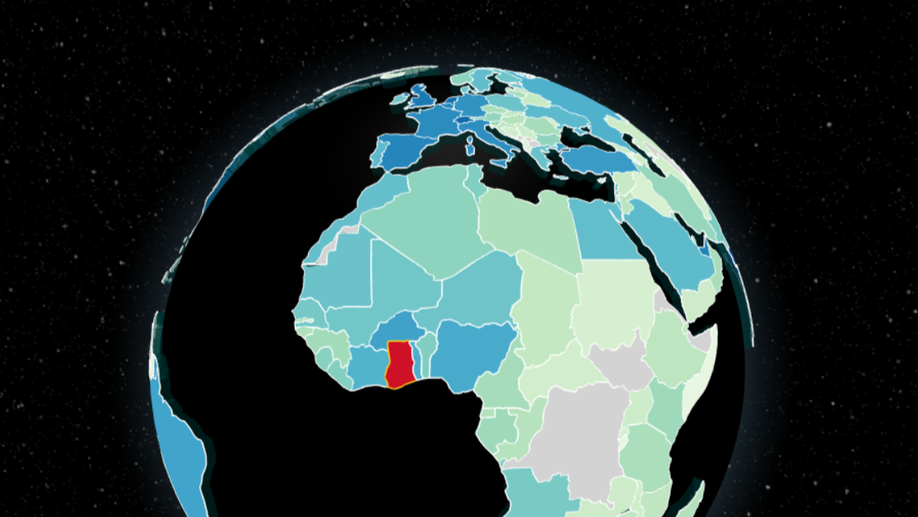
Using D3.js and Globe.gl to Create a 3-dimensional Choropleth of Trading Partners of Ghana Using Comtrade Data

Using D3.js and Globe.gl to Create a 3-dimensional Choropleth of Trading Partners of Ghana Using Comtrade Data

In this walkthrough I show how to use Comtradr API to download trade data and then visualize, in an overly complex way, this data using D3.js and Globe.gl. Have fun playing with it

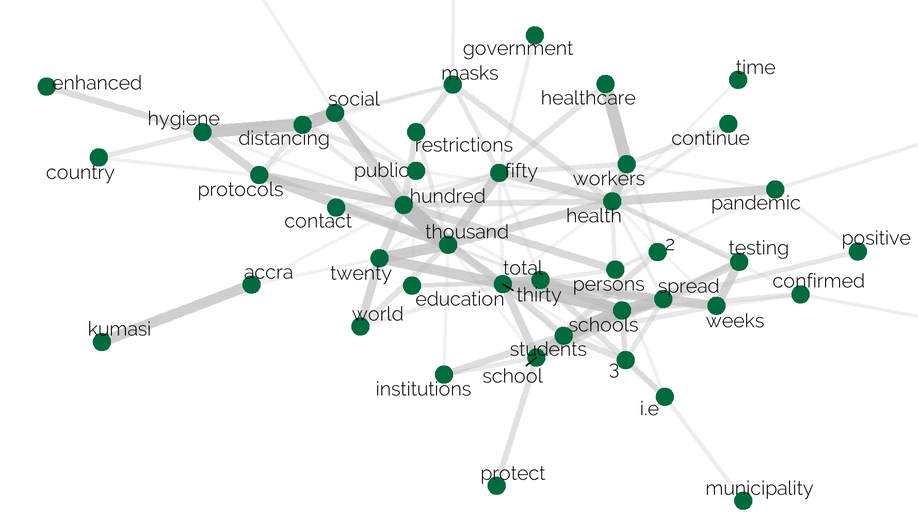
Using Tidytext and SpacyR in R to do Sentiment Analysis on the COVID-19 Update Speeches by the President of Ghana.

Using Tidytext and SpacyR in R to do Sentiment Analysis on the COVID-19 Update Speeches by the President of Ghana.

In this walkthrough I show how to use Rvest to scrape the speeches from the Ghanaian president on the topic of COVID-19 and how to use tidytext and SpacyR in R to do a sentiment analysis on these speeches to analyse them.

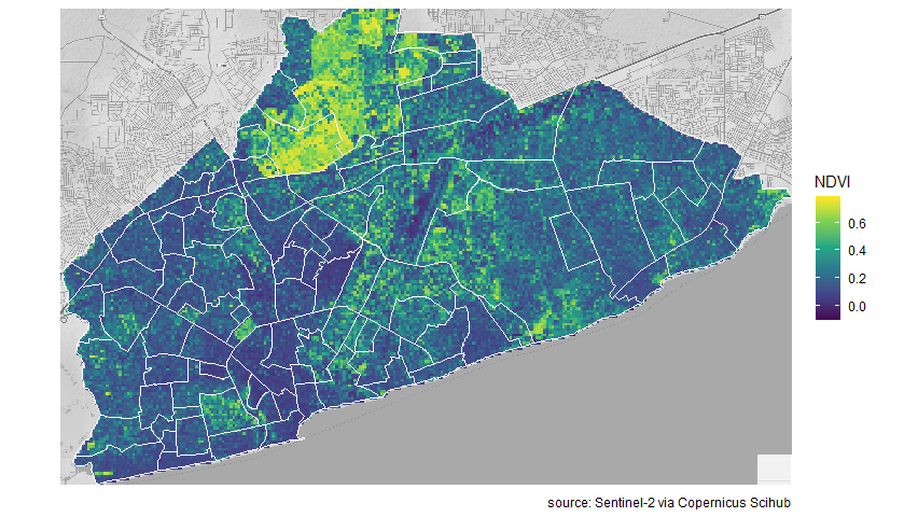
Finding the Greenest Neigbourhood in Accra Using Open-source Satellite Sentinel-2 NDVI Data

Finding the Greenest Neigbourhood in Accra Using Open-source Satellite Sentinel-2 NDVI Data

This walkthrough shows you how to download multispectral satellite (sentinel-2) in R, calculate the NDVI, create spatial statistics for different neighbourhoods using shapefiles, and plot the results. Spoiler: the University of Ghana Campus is the greenest neigbourhood in Accra.

Contact