Using D3.js and Globe.gl to Create a 3-dimensional Choropleth of Trading Partners of Ghana Using Comtrade Data
Introduction
For my work I came across this quite terrible data visualization by the UN FAO. It is mind-blowingly complex, overdesigned and really only shows very limited information. All of this could have fitted in a modestly sized table. There is a day/night shadow being rendered for some reason, the combination of North America and Europe, leads a placement of bubbles in the middle of the ocean, it is unclear how the size of the bubbles relate or scale, no borders are drawn (but elevation/relief is for some odd reason), which means it looks like there is a Sudan, but no South Sudan, because there is no data on South Sudan. It suffices to say, I was inspired. I love some data visualization for the sake of data visualization and decided to make my own. Instead of hunger, I used trade. Instead of the weird 3 dimensional bubbles hovering above an unnecessarily precise map I used the more commonsensical solution of a choropleth.
I did still want to use a 3d globe with some information that pops up when you hover over it. R is really not built for these types of interactive web visualizations, so I realized I needed to venture out to Javascript. Specifically I used the Javascript libraries D3.js and globe.gl. I had not worked with either before, but found great learning resources here, here, and here. My final product also borrows a lot of code and ideas from covid3d.live, a great COVID-19 visualization by Robert Soriano.
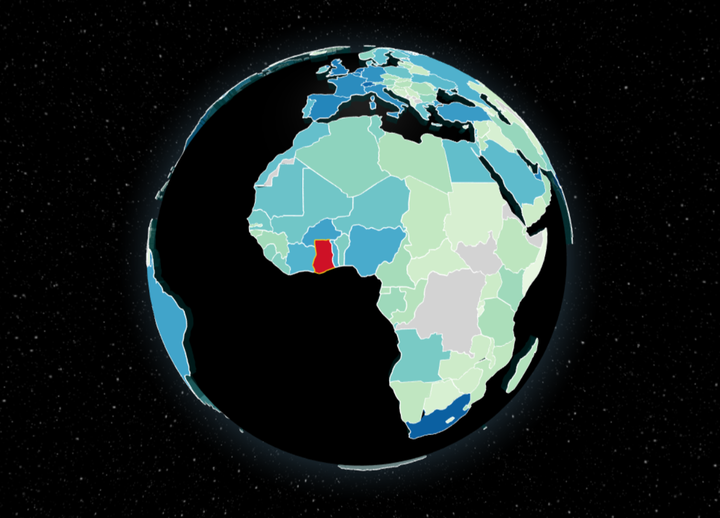
We see that in China and India are the largest trading partners of Ghana and that South Africa is the largest trading partner within Africa. Gold, Cocoa, and Oil are often the largest export commodity. The largest import commodities vary more from country to country. Who, for example, would have known that fur skin would have been the largest import to Ghana from Tajikistan.
Trade Data
To get the trade data I used the UN Comtrade database. This database summarizes the import and export flows of different goods and services between countries for a given year or even month. The UN summarizes the database as:
“UN COMTRADE is the pseudonym for United Nations International Trade Statistics Database. Over 170 reporter countries/areas provide the United Nations Statistics Division (UNSD) with their annual international trade statistics data detailed by commodities/service categories and partner countries. These data are subsequently transformed into the United Nations Statistics Division standard format with consistent coding and valuation using the processing system.
The UN COMTRADE is the largest depository of international trade data. It contains well over 3 billion data records since 1962 and is available publicly on the internet. In addition, it offers public and premium data API for easier integration/download.
All commodity values are converted from national currency into US dollars using exchange rates supplied by the reporter countries, or derived from monthly market rates and volume of trade. Quantities, when provided with the reporter country data and when possible, are converted into metric units. Commodities are reported in the current classification and revision (HS 2012 in most cases as of 2016) and are converted all the way down to the earliest classification SITC revision 1."
I choose to limit my data to just 2018 and, of course, to Ghana. Comtrade has an API you can query, but there is also a R package, called comtradr, that can easily query the API for you and return the data in a nicely formatted dataframe. I wanted to include the largest import and export category per country in addition to the total import and export category. That query unfortunately is too big for the API use limits, so I needed to loop over a query for every country individually. However, that violated the API’s limit of 100 requests per hour. To solve that I included a while loop that checks if the number of queries that is still allowed is still 0 and freezes R for 60 seconds if that is the case and then tries again.
Packages
library(comtradr)
library(tidyverse)
library(rgdal)
library(geojsonio)
Download data
comtrade_data <- ct_search(reporters = "Ghana",
                           partners = "all",
                           trade_direction = c("exports","imports"),
                           start_date = "2018",
                           end_date =  "2018")
After downloading the data, I select the variables I need, reform the data to a long format using pivot_wider() and calculate the total trade as the sum of export and imports.
comtrade_data_updated <- comtrade_data %>%
  select(partner, partner_iso, trade_value_usd, trade_flow) %>%
  pivot_wider(names_from  = trade_flow,
              values_from = trade_value_usd,
              values_fill = 0) %>%
  mutate(Total = Import + Export)
Now we have the import and export for all the countries. The next step is getting the largest import and export to/from Ghana for all the countries and enriching the data with that. There is a small bug in the Comtrade API, this means you need to ask for “Swaziland” as input, but get “eSwatini” as output.
# get list of trading partners
trading_partners <- comtrade_data_updated$partner

# Change Eswatini to Swaziland
trading_partners[trading_partners == "Eswatini"] <- "Swaziland"

# Create empty list
list_results <- list()

# Loop over results
for (country in 1:length(trading_partners) ){

  all_trades <- ct_search(reporters = "Ghana",
                   partners = trading_partners[country],
                   commod_codes = "all",
                   trade_direction = c("exports","imports"),
                   start_date = "2018",
                   end_date =  "2018")


  # due to some bug, sometime the API will not return the data I am asking for
  # I think this might have something to do with comtradr library

  if(nrow(all_trades) == 0){
    all_trades <- ct_search(reporters = "Ghana",
                            partners = trading_partners[country],
                            commod_codes = "all",
                            trade_direction = "all",
                            start_date = "2018",
                            end_date =  "2018")
  }else{

  }

  if(nrow(all_trades) == 0){
    all_trades <- ct_search(reporters = "Ghana",
                              partners = trading_partners[country],
                              commod_codes = "all") %>%
      filter(period == 2018)
  }else{

  }

  highest_trades<- all_trades %>%
    filter(commodity_code != "TOTAL") %>%
    group_by(trade_flow) %>%
    # products are listed under different levels of SITCs
    # I am only interested in the most 'precise' description,
    # so I keep the ones the highest aggregate level (max 6)
    filter(aggregate_level == max(as.numeric(aggregate_level))) %>%
    # I only want to keep the commodity with the highest value
    filter(trade_value_usd == max(trade_value_usd)) %>%
    ungroup() %>%
    select(partner ,partner_iso, commodity,trade_flow,trade_value_usd) %>%
    pivot_wider(
      names_from = trade_flow,
      names_glue = "{trade_flow}_{.value}",
      values_from = c(commodity, trade_value_usd),
      values_fill = NA
    )

  list_results[[country]] <- highest_trades

  print(trading_partners[country])

  # check if there are any queries remaining,
  # if not pause for 60 seconds and try again
  while(ct_get_remaining_hourly_queries() == 0){
    print(paste0("wait for ", as.double(ceiling(ct_get_reset_time() - Sys.time())), " more minutes"))
    flush.console()
    Sys.sleep(60)
  }
}
Now I can bind all the results together. For Ghana I would like to get the total (World) value.
tibble_res <- data.table::rbindlist(list_results, fill=TRUE) %>%
  as_tibble()


# Change world to Ghana for later data wrangling
comtrade_data_updated_2 <- comtrade_data_updated %>%
  left_join(tibble_res, by = c("partner", "partner_iso")) %>%
  mutate(partner = ifelse(partner   == "World", "Ghana", partner),
         partner_iso  = ifelse(partner_iso   == "WLD", 'GHA', partner_iso))
Adding Data to Shapefile
To project the data on a nice globe, it needs to be in the shape of a shapefile. globe.gl uses .geojson as file types, so I downloaded a shapefile of the world in this format, added my variables and saved it again as .geojson. I used
this shapefile. I used the explanation in
this GIS Stack Exchange post to transform the data back to the right shapefile.
# load in shapefile
World_polygon <- readOGR(dsn = "ne_110m_admin_0_countries.geojson")

# extract data
dat <- World_polygon@data


# add the data I want to add to the data
dat_updated <- dat %>%
  dplyr::select(ISO_A3, ISO_A2,NAME) %>%
  # for some reason the iso code for France and Norway are missing
  # so I fixed these manually
  mutate(ISO_A3 = ifelse(NAME == "France", "FRA", ISO_A3)) %>%
  mutate(ISO_A3 = ifelse(NAME == "Norway", "NOR", ISO_A3)) %>%
  mutate(ISO_A2 = ifelse(NAME == "France", "FR", ISO_A2)) %>%
  mutate(ISO_A2 = ifelse(NAME == "Norway", "NO", ISO_A2)) %>%
  left_join(comtrade_data_updated_2, by = c("ISO_A3" = "partner_iso")) %>%
  # I want to colour missing values in grey in the visualization,
  # therefore I gave missing values a value of -1.
  # This is needed because teh d3.js colour scale I uses needs numeric values
  # for the transformation.
  mutate(Total = ifelse(is.na(Total), -1, Total)) %>%
  mutate(Import = ifelse(is.na(Import), -1, Import)) %>%
  mutate(Export = ifelse(is.na(Export), -1, Export)) %>%
  mutate(Export_trade_value_usd = ifelse(is.na(Export_trade_value_usd), -1, Export_trade_value_usd )) %>%
  mutate(Import_trade_value_usd = ifelse(is.na(Import_trade_value_usd), -1, Import_trade_value_usd)) %>%
  as.data.frame()


# transform data to  to right format
pid <- sapply(slot(World_polygon, "polygons"), function(x) slot(x, "ID"))
row.names(dat_updated) <- pid
World_polygon@data <- dat_updated

# Save data
country_json <- geojson_json(World_polygon)
geojson_write(country_json, file = "country.geojson")
The next step is to load this data into Javascript and make the visualization. I did this in Visual Studio Code in combination with the live server extension. Nonetheless, this is the Javascript code I used:
 // create a colour scale
          const colorScale = d3.scaleSequentialPow(d3.interpolateGnBu).exponent(0.15);

          // centre map at Ghana
          const MAP_CENTER = {lat: 6.518, lng: -0.27, altitude: 1.8};

          // assign url where to find flags
          const flagEndpoint = 'https://corona.lmao.ninja/assets/img/flags';

          // load in the geojson data
          // and set feature I want to plot (trade value)
          const getVal = feat => feat.properties.Total;
          fetch('country.geojson').then(res => res.json()).then(countries =>

          {

            //const maxVal = Math.max(...countries.features.map(getVal));

            // I have to make sure that in the colour scale I do not include the World Total (Ghana).
            // So, I am setting a manual domain.
            colorScale.domain([0, 4345000000]);

            const world = Globe()
              // by default there is a little map image overlaid, but I do not need that
              //.globeImageUrl('//unpkg.com/three-globe/example/img/earth-night.jpg')
              // add a nice night sky
              .backgroundImageUrl('//unpkg.com/three-globe/example/img/night-sky.png')
              .polygonsData(countries.features)
              .polygonAltitude(0.03)
              // make countries without data light grey and make Ghana the red colour of the Ghanaian flag
              .polygonCapColor(feat => feat.properties.NAME === "Ghana" ? 'rgb(206, 17, 38)': getVal(feat) === -1 ? 'lightgrey' : colorScale(getVal(feat)))
              .polygonSideColor(() => 'rgba(0, 50, 50, 0.5)')
              .polygonStrokeColor(feat => feat.properties.NAME === "Ghana"  ? 'rgb(252, 209, 22)' : 'white')
              .polygonLabel(
      ({ properties: d, covidData: c }) => {
       const flagName = d.ISO_A2.toLowerCase();
        return `
        <div class="card">
          <img class="card-img" src="${flagEndpoint}/${flagName}.png" alt="flag" />
          <div class="container">
          <span class="card-title">${d.NAME}</span> <br />
          <div class="card-spacer"></div>
             <hr />
             <div class="card-spacer"></div>
             <span><b>Total Trade:</b> ${d.Total === -1  ? 'No Data available' : d3.format('.4s')(d.Total).replace(/G/,"B USD").replace(/M/,"M USD").replace(/k/,"k USD") } </span><br />
             <span><b>Total Export:</b> ${d.Export === -1  ? 'No Data available' : d3.format('.4s')(d.Export).replace(/G/,"B USD").replace(/M/,"M USD").replace(/k/,"k USD") } </span> <br />
             <span><b>Total Import:</b> ${d.Import === -1  ? 'No Data available' : d3.format('.4s')(d.Import).replace(/G/,"B USD").replace(/M/,"M USD").replace(/k/,"k USD") } </span>

             <div class="card-spacer"></div>
             <hr />
             <div class="card-spacer"></div>
             <span><b>Largest Export:</b> ${d.Export_trade_value_usd  === -1 ? 'No Data available' : d.Export_commodity}</span><br />
             <span><b>Value largest Export: </b>${d.Export_trade_value_usd  === -1 ? 'No Data available' : d3.format('.4s')(d.Export_trade_value_usd).replace(/G/,"B USD").replace(/M/,"M USD").replace(/k/,"k USD") } </span><br /><br />
             <span><b>Largest Import:</b> ${d.Import_trade_value_usd  === -1  ? 'No Data available' : d.Import_commodity}</span><br />
             <span><b>Value largest Import: </b>${d.Import_trade_value_usd  === -1  ? 'No Data available' : d3.format('.4s')(d.Import_trade_value_usd).replace(/G/,"B USD").replace(/M/,"M USD").replace(/k/,"k USD") } </span>

          </div>
        </div>
      `
      }
    )
              .onPolygonHover(hoverD => world
                .polygonAltitude(d => d === hoverD ? 0.1 : 0.03)
                .polygonCapColor(d => d === hoverD ? 'rgb(0, 107, 63)' : getVal(d) === -1 ? 'lightgrey' : d.properties.NAME === "Ghana"? 'rgb(206, 17, 38)' :  colorScale(getVal(d)))
              )
              .polygonsTransitionDuration(200)
              .pointOfView(MAP_CENTER, 10)
            (document.getElementById('globeViz'))
To make the code work (loading D3.js and globe.gl), I also added <script src="//unpkg.com/d3"></script> and <script src="//unpkg.com/globe.gl"></script> to this page in the HTML. Finally, to complete the looks of the visualization, I added the following elements to the .css file of the website:
.card {
  font-family: 'Space Mono', monospace;
  transition: 0.3s;
  background-color: black;
  width: 290px;
  border: 4px solid  rgb(0, 107, 63) ;
  border-radius: 10px;
  z-index: 2;
  margin: 0;
  padding: 0;
}

.container {
  /* padding: 3px 16px; */
  padding-top: 1px;
  padding-bottom: 8px;
  padding-left: 12px;
  padding-right: 12px;
  text-align: left;
  margin: 0;
  padding: 0;
}

.card-img {
  object-fit: contain;
  width: 100%;
  border-top-left-radius: 10px;
  border-top-right-radius: 10px;
  margin: 0;
  padding: 0;
}

.card-title {
  font-weight: bold;
  margin: 0;
  padding: 0;
}

.card-spacer {
  height: 1px;
  margin: 0;
  padding: 0;
}


.scene-tooltip {
  z-index: 2;
  margin: 0;
  padding: 0;
}
Ghana Data Stuff
This website is my hobby project to showcase some of the project I am working one, when I am not working on the official statistics at the Ghana Statistical Service.